Seven Steps to Become Better at Excel
You’ve taken courses, learned how to use formulas, and even started using INDEX/MATCH. But you see other people in your office that still seem to know everything about Excel and you don’t.
How did they become experts? More importantly, how can YOU get better at Excel and become an expert?
In this guide we’ll discuss the path from being a normal Excel user to an Excel expert.
Here’s an overview:
1. Get more hands-on experience
2. Don’t be afraid to rebuild workbooks from scratch
3. Learn how to make speed improvements
4. Remove steps for the user
5. Use colors sparingly and for practical purposes
6. Use simple graphs
7. Start to learn other languages to reduce what ends up in your spreadsheet

Get more hands-on experience
The only way you can get better at something is by doing it. You need to live in Excel. You need to run across real issues, struggle with them, and research the best answer online BEFORE asking the expert in your office.
But you might ask, “How can I get challenging Excel assignments if I’m not good enough to do them yet?”
Talk to your resident Excel expert
Find the Excel expert in your office. The next time they are asked to build a new spreadsheet, ask them to save a copy of the assignment so you can try it by yourself, as if it were assigned to you, even though their solution will be the one that is used. It is the best way to mimic real experience, since it is a completely real-world assignment, and there’s no real pressure since you are just practicing.
When you are done and have come up with a working solution, ask to see the Excel expert’s finished workbook. Because you’ve struggled with the assignment, you’ll better appreciate and remember the methods the Excel experts used to get around certain problems.
You can also ask the Excel expert in your office to see if they have any old assignments saved. See if they can set you up with the scenario they were presented with in the past and try to do the assignment yourself in your own workbook.
Volunteer your Excel services
If you don’t have an Excel expert in your office, offer your services for free to local small businesses. Just say,
“Hey, I’m trying to get better at Excel. I don’t want any money—do you mind if I take a look at any of your processes to see if I can automate them for you?”
Even though you might see some confused faces, I guarantee that whatever Excel level you are at now, you’ll be able to find a business that can use your services (even if they don’t know it). Again, you’ll see real issues people face in their businesses and learn how to use Excel to solve them.
Don’t be afraid to rebuild workbooks from scratch
Does this situation sound familiar? An office uses a workbook that takes three hours to run, but hey, it works and it’s really important, so let’s not touch it to make it better.

That’s called fear. When it’s a complicated file, it can seem intimidating to rebuild it from scratch. Your less Excel-savvy colleagues might also be nervous about learning a new process or don’t trust that you can build a new file that will work every time like the old one.
My general rule of thumb is this: if there is discussion about potentially rebuilding a workbook, then rebuild it.
Workbooks tend to go through the same life cycle:
The workbook is built to accomplish a specific purpose.
Additional features are added to the original workbook over time while other features are removed.
It is too hard to redesign the workbook properly to incorporate the added/removed features. The workbook therefore has data that it doesn’t need or the same data in a few different places.
1. The workbook gets slow and unwieldy.
2. Employees turnover and no one understands exactly what is going on in the file.
3. People are too nervous to redesign it.
4. The process stinks and the file starts to crash or takes four hours to run.
If you want to get better at Excel, you have to learn to overcome this problem because this is one of the most important places you can add value to your organization.
This problem is not just an Excel problem–it’s a people problem. These old workbooks don’t get rebuilt because analysts don’t have a plan of attack for convincing others the file needs to be rebuilt.
The Rebuild Phase
I’ve found the best way is to open a new workbook and start redesigning the file in the new workbook. From scratch. Don’t paste anything in from the old workbook.
Tell your colleagues that you are just testing what a rebuild would look like to see if you can make the workbook faster. Tell them you completely understand how important the file is and that you know there are risks to using a new workbook that might do things incorrectly.
Then put the time in to understand how the file works. Where does the data come from? What does the output look like? What’s happening in between? Trace every formula. Seriously, trace every formula. It might seem like it will take forever, but it will save you time in the long run if you understand the file first. Otherwise, you’ll spend forever trying to figure out where the errors are coming from later on.
Rebuild the file and make it as lean as possible. Since this is just a test file, if you are unsure whether something needs to be left in the file, leave it out. Again, don’t be afraid. You want to make the new file as small as possible while still accomplishing the same goals.
The Testing and Marketing Phase
Once you think your file is done, do not replace the old file immediately. Instead, show your colleagues the new file and say that, for the next couple weeks, you’ll run this file in parallel with the old file to make sure you can catch every mistake. The key word here is you. You run the new file while your colleagues run the old file—you don’t want to make them run both and put more work on their plate.
Every time you run both files in parallel, ask you colleagues to help you compare the new file’s output to the old one’s so they can slowly get used to seeing the new file. If your new file is significantly faster, let them run the old file first, then announce you are running the new file. Then tell them you are ready to compare the two once the new file is done running. This strategy implicitly shows them how much faster the new file is.
After correcting the new file a few times due to discrepancies between the files, I usually notice that the differences between the two files start to be because the old file is wrong rather than the new. After all, you just rebuilt the file from scratch while the old file has had feature after feature hastily cobbled together after its original creation. Because your colleagues are part of the checking process, they’ll notice it too and see the value of the new file.
And if that doesn’t happen, usually your colleagues will begin to trust the new file as they see it is the same thing and want to save themselves the trouble of using the old one.
Learn how to make speed improvements
For an Excel expert, it’s not good enough to make things work. You must do it efficiently. If you build a file and the sheet is constantly strained from too many calculations, you’re not helping anyone. We’ve written before on how to make your workbooks faster, but I’ll summarize the main points here:
1. Reduce volatile formulas
2. Don’t use arrays
3. Order conditions efficiently
4. Calculate important values once rather than recalculate them over and over again
But most importantly, use your brain. Many of the workbooks I’ve been asked to fix can be simplified just by using logic. Ask yourself, can I produce the same output using three steps instead of ten?
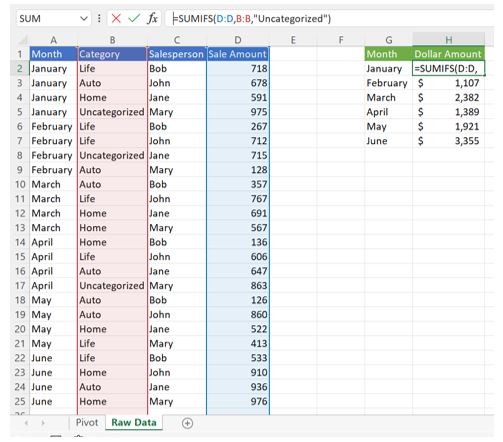
Sometimes the workbooks you are trying to improve will reflect the original builder trying to reason out the process as they are building the file. On one tab you’ll see all the raw data, then the next tab will have a pivot of that data with some of it filtered out. There will be some calculations off that pivot that then lead to a new tab that summarizes the data again.
Most of the time, you can just calculate the final summary tab off the raw data.

In the example above, the pivot table that filters out the “Uncategorized” sales isn’t necessary. We can skip straight to using a SUMIFS instead.
People also will often dump in all the data available to them just in case they need it. But once the workbook is complete, you should be able to go back and drop a bunch of unnecessary columns that were only in the file “just in case.”
Remove Steps for the User
The ideal Excel workbook should have instructions that look like this:
1. Paste in data from outside source
2. Hit Calculate
3. Export results
Anything more complicated than this might mean the file has room for improvement. If you reduced the size of your workbook, you should now have the file/calculation space to add formulas to remove some user-generated steps.
For example, if you have a process that relies on the user manually removing duplicates or refreshing a pivot mid-way through a longer list of steps, you can remove those steps using formulas.
If your file has data organized one way, but the place you need the output to go needs it organized differently, consider using formulas to reshape the data.
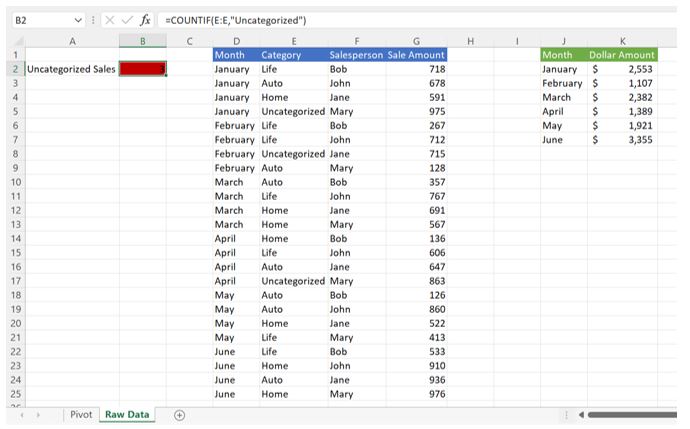
If part of the process to run a workbook requires the user to scroll through and check the data, add a formula to do the check, and highlight a concerning value using conditional formatting.
Use Colors Sparingly and for Practical Purposes
The use of color can help organize your file, both for the end user and anyone trying to troubleshoot it.
But don’t overdo it! Too much color will just confuse the user.
I had a boss open an overwhelmingly colorful file once and remark, “It looks like it was designed by the Jetsons.”

Column Headers
In general, I’ve noticed files need only two or three colors. On a sheet where I’m pasting in data, I make the headers of the pasted data blue (with white text). If there are any formulas next to the data, I make the headers green (with white text). This way, if I paste in the underlying data and it spills over into the green columns, I can tell that a new column has been added to the underlying data and I need to change the sheet.
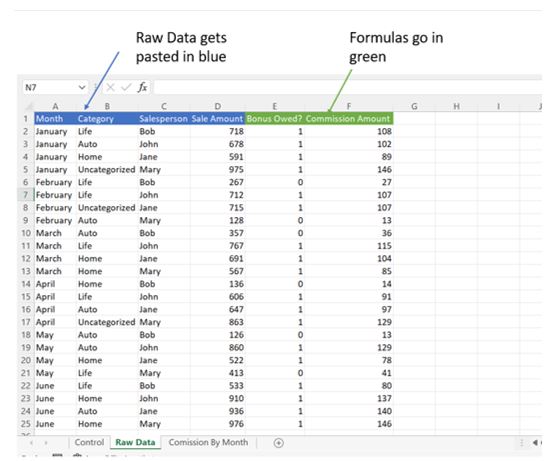
If I’m adding a check column, I sometimes will make the header red rather than green, so I know that column is doing a check.
Tab colors
The tab colors largely mirror the column headers. If a tab takes raw data from outside the spreadsheet, I make it blue. If it contains the final output of the sheet, I make it green.


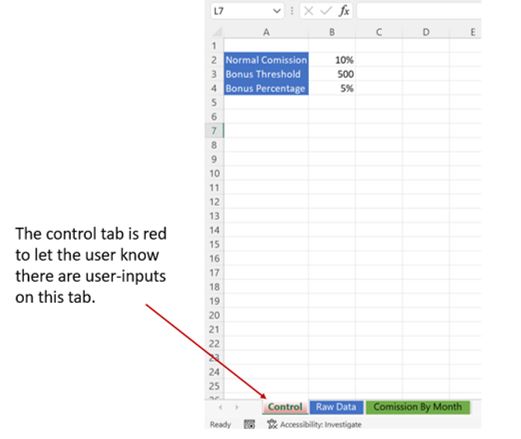
My team uses the same color-coding methodology, so if someone new is using the sheet, they can immediately tell what each tab is used for and know that they need to get the raw data into the blue tabs so the green tabs will populate. If there is a control tab with user-generated inputs, I often make that tab red to alert the user.
Simplify Graphs
This recommendation is slightly tangential to Excel, but because many files summarize data using graphs, I thought it might be helpful, nonetheless.
Just like color usage, you need to simplify your graphs to get better at Excel.
Analysts feel safe behind complex looking graphs. It makes them look smart and no one understands what the graph means, saving the analyst from, you know, needing to analyze the information in a helpful way.
Maybe you can eek out a career always making it seem like you’re too smart for everyone else, but I’d argue you’d probably be better off if people actually understood what the heck you’re talking about and could use it to weigh their next decision.
I highly recommend a lecture and book on this topic by Cole Nussbaumer Knaflic.
In general, the keys are to pick simple graphs (generally just use bar and line graphs), reduce clutter, and then use color to highlight the takeaway for the end user. Don’t be afraid to write the main takeaway directly on the graph.
For example, here is survey data I helped analyze for an online drone education company:
Which graph better conveys the information?

OR

Notice how the second graph uses sorting, data labels, and color to highlight the point also written directly on the graph. To help better display sorting, I used a horizontal bar chart instead of a pie chart. If you want to make a second point about the graph, just repeat the graph and change the coloring:

Start to learn other coding languages
If you want to get better at Excel, it can help to learn languages outside of Excel and combine them with your Excel abilities to achieve success.
SQL
For example, many Excel users grab data that is stored in a database and then use Excel to do join the data with other datasets, perform calculations, or summarize the data for other employees.
If the data can be stored in a database, then you might be able to reduce the size of the data before it even touches Excel using SQL, a language used to query databases. Rather than dumping in every row of data, you can easily filter, perform calculations, and join the data to other datasets in the same database using just a few lines of code. You can even have your queried data enter Excel from the database automatically using the Get Data feature of Excel or Power Pivot.

Using SQL ahead of time and automatically linking your queries to Excel is useful for two reasons. First, filtering and performing calculations on the data ahead of time will reduce the number of calculations you need to do in Excel. You can then use the calculation savings to improve other areas of the workbook that might reduce steps for the user. And second, automatically linking the data to Excel reduces a user step of having to go to the database and retrieve the data on their own. The process becomes just right clicking a table already within the file and clicking refresh, which is easy for any employee to do.
VBA
If you’ve ever heard the term “macro” used to describe code in an Excel spreadsheet, then you’ve come across Visual Basic for Applications (VBA).
VBA is an easy-to-learn computer language designed by Microsoft that allows users to harness some basic coding features within Microsoft products.
If you have a workbook that requires many steps to run, you can replicate the process in VBA and have the user click a button to run the workbook. Excel can even record your actions and translate them to VBA code that you can run again later.
For example, if you wanted to copy and paste data from one tab to another and then sort that data, you could record yourself doing those actions and then run the code the next time you need to run the file. As you can imagine, VBA becomes especially helpful when a process has many steps.
Not only can VBA save you tedious steps in running a file, but it also can utilize standard programming features, such as if statements and for loops. (If you don’t know what those are, no need to worry.) For example, say you want to calculate whether the sales date fell in one of the promotion windows:
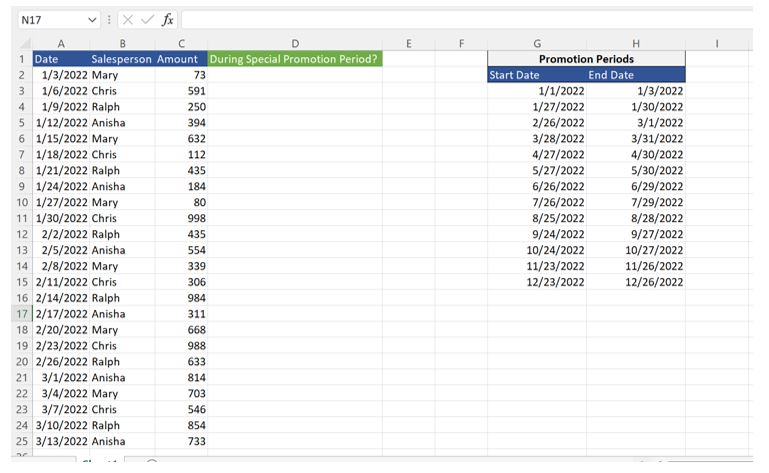
We can use an IF statement with many OR statements in a formula to test each date against each window. But that’s a lot of OR statements to put in one formula. Imagine writing a formula for five years of data instead of one.
Instead, we could use VBA to perform the calculation using an IF statement and a loop. The code looks something like this and performs the calculations almost instantly:
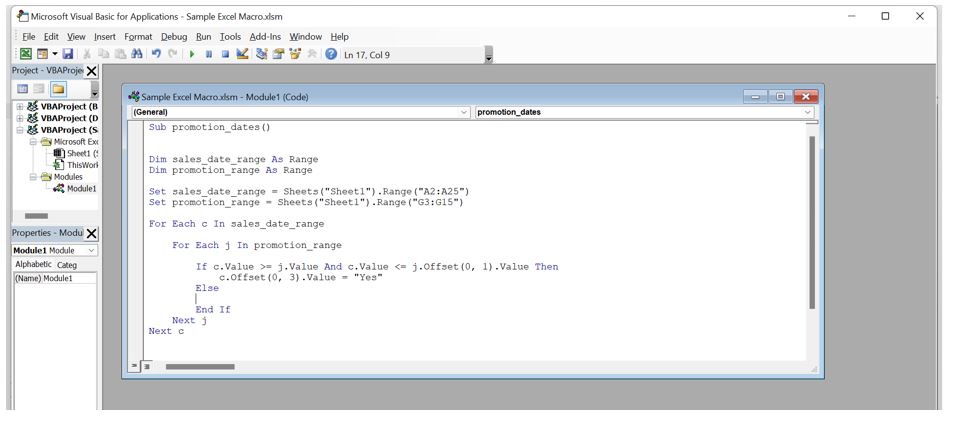

If you’d like to learn more about VBA and how it can improve your spreadsheets, check out this free tutorial series by Excel Easy.
Conclusion
If you take nothing else away from this article, know that getting better at Excel is as much about developing your soft skills as deepening your knowledge of formulas. But, most importantly, you need to practice. Practice on real problems and keep researching better ways to do things. I find that, with heavy real-world practice and intentionality, you can become an “expert” in about two or three years. Though there will always be more to learn, you’ll then have the skillset for life.